
In today’s competitive manufacturing landscape, data is more than just numbers—it’s the lifeblood of strategic decision-making. For companies in the manufacturing sector, sales and market statistics can reveal where the business is thriving, where it’s falling behind, and where the next big opportunities lie. The challenge? Turning that flood of data into clear, actionable intelligence.
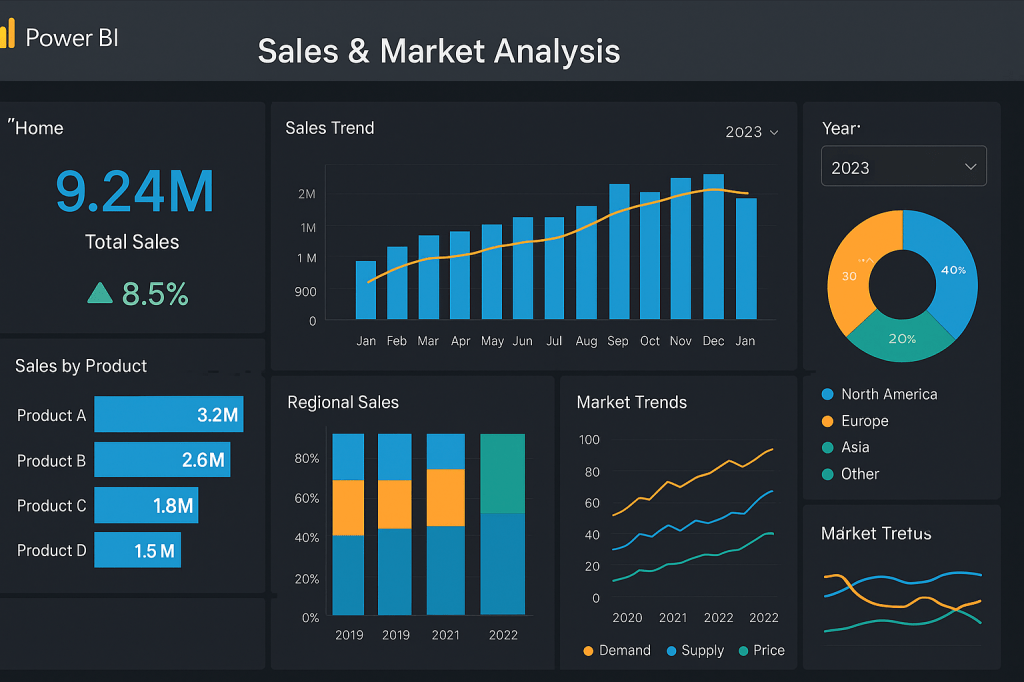
That’s where Microsoft Power BI comes in. This powerful business intelligence tool can transform complex datasets into visually engaging dashboards, interactive reports, and predictive insights—giving manufacturing firms the competitive edge they need.
In this article, we’ll explore how Power BI works, its core features, and the specific benefits it offers manufacturing firms seeking to optimize sales strategies, forecast market trends, and enhance decision-making.
What Is Microsoft Power BI?
Microsoft Power BI is a business analytics solution that enables organizations to visualize their data, share insights across teams, and integrate analytics directly into their workflows. It connects to multiple data sources—spreadsheets, ERP systems, CRM platforms, IoT devices, and cloud services—allowing you to create a single, unified view of your business performance.
For manufacturers, this means:
- Sales performance data from different regions consolidated in real time.
- Market trends visualized through interactive charts.
- Production data connected to customer demand forecasts.
In short, Power BI turns raw numbers into business intelligence that drives better, faster decisions.
Why Power BI Is a Game-Changer for Manufacturing Firms
Manufacturing companies deal with enormous data streams—sales numbers, production volumes, market demand signals, supplier performance, and more. Without a unified system to analyze these inputs, valuable insights can get lost in spreadsheets and siloed systems.
Here’s why Power BI is particularly valuable in a manufacturing context:
1. Real-Time Sales Dashboards
Instead of waiting for monthly or quarterly reports, Power BI allows you to view up-to-the-minute sales performance. This is crucial for adjusting pricing strategies, reallocating marketing spend, or identifying underperforming territories.
Example: A manufacturing firm selling industrial equipment can see in real time which product lines are outperforming in specific regions, allowing sales managers to double down on promotions or shift inventory.
2. Market Trend Analysis
With its advanced data modeling, Power BI can integrate internal sales data with external market intelligence—such as industry benchmarks, economic indicators, and competitor performance metrics.
SEO keyword focus: market analysis in manufacturing with Power BI.
This integration allows manufacturers to identify:
- Shifts in customer buying behavior.
- Emerging market opportunities.
- Seasonal demand fluctuations.
3. Supply Chain Optimization
Power BI can connect to ERP systems, supplier databases, and logistics platforms, creating a holistic view of the supply chain. This enables predictive modeling to anticipate delays, optimize inventory levels, and align production with actual demand.
4. Customizable KPIs
Every manufacturing business has unique success metrics—gross margin by product line, market share percentage, or customer acquisition cost. Power BI allows you to create custom KPI dashboards that reflect your priorities.
Key Features of Microsoft Power BI for Manufacturing Sales & Marketing Intelligence
1. Data Connectivity
Power BI connects to hundreds of data sources, including:
- ERP systems like SAP, Oracle, or Dynamics 365.
- CRM platforms like Salesforce.
- Cloud storage like Azure, AWS, and Google Drive.
- SQL databases and on-premises servers.
- Excel spreadsheets and CSV files.
SEO keyword focus: Power BI data integration for manufacturing.
2. Data Transformation with Power Query
Power BI’s Power Query tool lets you clean, shape, and transform raw manufacturing data into structured, usable formats. This is particularly helpful when sales data comes from multiple distributors with inconsistent formats.
3. Interactive Visualizations
From heat maps showing regional sales to trend lines tracking revenue over time, Power BI’s visuals make complex manufacturing data easy to understand at a glance. Interactive filters allow managers to drill down from global overviews to product-level details.
4. Predictive Analytics
With AI-powered features and integration with Azure Machine Learning, Power BI can forecast sales demand, identify at-risk markets, and even detect anomalies in pricing or customer orders.
5. Mobile Accessibility
Manufacturing executives and sales teams often work on the go. Power BI’s mobile app ensures decision-makers can monitor KPIs and market trends from anywhere.
Example Use Case: Power BI in a Mid-Sized Manufacturing Firm
Company Profile:
A mid-sized manufacturer of consumer electronics wants to understand why its sales in North America are stagnating while European markets are growing.
Implementation in Power BI:
- Data Connection: Link sales data from the company’s ERP system, marketing campaign results from the CRM, and third-party market reports.
- Dashboard Creation: Build a regional performance dashboard showing product sales by geography, profit margins, and market share trends.
- Trend Analysis: Identify that European sales growth is tied to a recent marketing campaign targeting a new product line, while North American sales are hampered by higher shipping costs.
- Actionable Insights: Adjust pricing for North America, negotiate better shipping contracts, and replicate the European campaign’s success in other regions.
Result: The company improves profitability and market penetration within six months.
Best Practices for Implementing Power BI in Manufacturing
1. Define Clear Objectives
Before diving into Power BI, outline what you want to measure. Are you focused on increasing market share? Improving sales forecasting? Reducing time-to-market?
2. Ensure Data Quality
Poor-quality data leads to misleading insights. Use Power Query to clean and standardize your datasets.
3. Start Small, Scale Fast
Begin with a few critical dashboards—such as sales performance and market analysis—then expand to cover supply chain, customer service, and production efficiency.
4. Train Your Team
Even the best dashboards are ineffective if your team doesn’t know how to interpret them. Invest in training so sales, marketing, and production managers can make full use of Power BI insights.
The Competitive Advantage of Power BI in Manufacturing
Manufacturing is becoming increasingly data-driven. Those who can harness the power of real-time business intelligence will have a decisive edge over competitors still relying on static reports.
Power BI empowers manufacturing firms to:
- React faster to market changes.
- Optimize sales strategies.
- Predict future trends.
- Align production with demand.
- Improve profitability.
By combining internal sales metrics with external market intelligence, Power BI turns data into strategy—a vital capability for any manufacturer aiming for sustainable growth.
Final Thoughts
In the manufacturing industry, data without insight is like machinery without power—it’s there, but it’s not doing the work. Microsoft Power BI is the engine that turns raw statistics into meaningful business intelligence.
Whether you’re analyzing sales by product line, comparing regional market performance, or forecasting demand for the next quarter, Power BI equips you with the tools to make smarter, faster, and more profitable decisions.
If your manufacturing firm hasn’t yet explored the full potential of Power BI, now is the perfect time to start.
“At CA Project Intelligence, our mission is to empower organizations to deliver projects smarter, faster, and with greater impact by merging proven project management expertise with the transformative power of artificial intelligence. We provide tailored solutions — from strategic planning to hands-on execution — that enhance productivity, optimize resources, and drive measurable results for every client.”

Leave a comment